
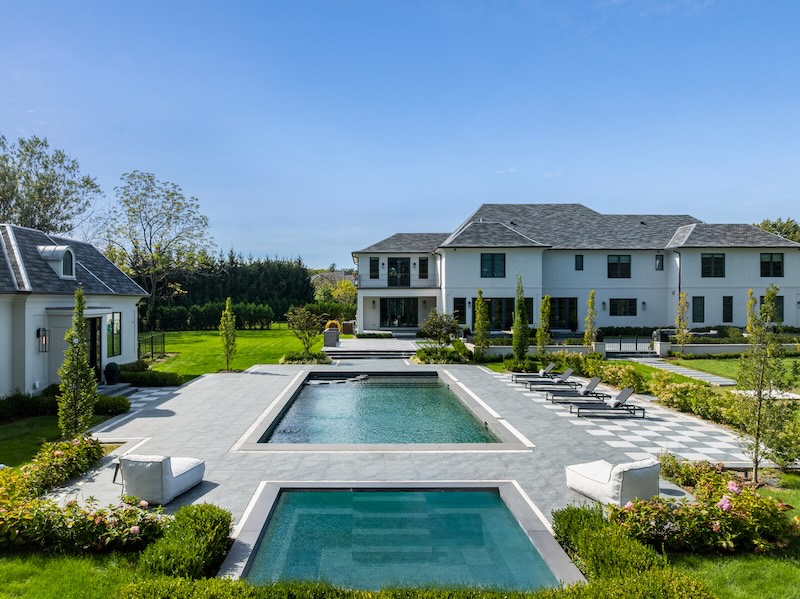
North Shore Long Island Luxury Real Estate Recap: Q3 2026
The third quarter of 2026 brought a meaningful increase in transaction activity across Long Island’s North Shore luxury market. While inventory remained elevated, substantially more $2M+ homes closed during the quarter, suggesting that buyers continued to engage when pricing and property quality aligned.
For this report, I analyzed the $2 million and above residential market across the same North Shore communities included in the Q2 report: Brookville, Old Brookville, Upper Brookville, Old Westbury, Locust Valley, Glen Head, Glen Cove, Oyster Bay, Oyster Bay Cove, Roslyn, and Sea Cliff.
During Q3, 48 properties in the $2M+ segment closed, while the broader market snapshot included 107 active listings and 42 pending sales.
Q3 Luxury Market Insights
Q3 North Shore Luxury Market at a Glance
Among the 48 closed sales:
- Median sale price: $2.663 million
- Average sale price: $3.338 million
- Highest sale price: $8.8 million
- Median days on market: 34 days
- Average days on market: 101 days
- Average sale-to-list price: 95.6%
- Median sale-to-list price: 96.3%
One of the clearest takeaways from Q3 is the increase in transaction volume. The data set recorded 48 closed sales during the quarter, compared with 17 in Q2.
At the same time, the median days on market remained almost unchanged at 34 days versus 33 days in Q2. This suggests that despite the increase in overall inventory, appropriately positioned luxury homes continued to find buyers relatively quickly.
Transaction Activity Increased Significantly
Q3 represented a much more active quarter for the $2M+ North Shore market.
The number of recorded sales increased substantially from Q2, while the average days on market for sold properties declined from 118 days to 101 days.
The highest transaction in the Q3 data set closed at $8.8 million, compared with $7.45 million during Q2, demonstrating continued activity at the upper end of the North Shore estate market.
However, the median sale price declined from $3.05 million in Q2 to approximately $2.66 million in Q3.
This does not necessarily indicate that property values fell by a comparable amount. In a relatively small luxury-market data set, quarterly averages and medians can shift considerably based on the mix of properties that happen to close. Instead, the figures suggest that a greater portion of Q3 activity occurred closer to the lower end of the $2M+ market.
Inventory Remains Elevated
At the time of this market snapshot, there were 107 active $2M+ listings, up from 99 in the Q2 report.
The median asking price was $3.995 million, while the average asking price was approximately $5.16 million. The highest-priced active property was offered at $25 million.
The median active property had been on the market for 90 days, compared with 82 days in the Q2 snapshot.
That combination—more inventory and a slightly longer median marketing time—means buyers currently have meaningful choice across the North Shore luxury market.
It also reinforces the importance of pricing for sellers. Buyers may be active, but they generally have enough inventory available that they do not need to pursue properties they perceive as significantly overpriced.
The Gap Between Asking Prices and Closing Prices Remains Important
One of the more interesting dynamics heading into Q4 is the difference between the price of available inventory and the price level where much of the market is actually transacting.
The median asking price among active $2M+ listings was approximately $4 million, while the median Q3 sale price was approximately $2.66 million.
As with Q2, this should not be interpreted as homes broadly selling at a one-third discount. The active and sold pools contain different properties, and the North Shore estate market varies tremendously based on acreage, location, condition, architecture, amenities, and school district.
What the numbers do indicate, however, is that current inventory remains weighted toward more expensive properties than the homes generating the greatest transaction volume.
For sellers at the upper end of the market, understanding the competitive set—and how buyers perceive value relative to other available estates—is especially important.
Sellers Captured a Greater Percentage of Asking Price
There was also an improvement in the relationship between asking and closing prices during Q3.
The average closed property sold for approximately 95.6% of its asking price, while the median was 96.3%.
In Q2, those figures were approximately 94.3% and 93.9%, respectively.
That improvement is notable because it occurred alongside higher inventory.
It suggests that when sellers and buyers did reach agreement during Q3, pricing expectations were somewhat more closely aligned than they had been during the previous quarter.
The data also reinforces an important distinction in the luxury market: days on market alone do not determine negotiating leverage.
Property condition, renovation quality, location, acreage, amenities, seller motivation, and initial pricing strategy can all have a greater impact on the eventual discount than the number of days a property has been listed.
Pending Sales Point to Continued Activity
There were 42 pending $2M+ properties at the time of this analysis.
The median asking price of those pending properties was approximately $3.1 million, while the average was approximately $4.25 million.
Once again, the median pending price is substantially below the nearly $4 million median asking price of active inventory.
That supports one of the broader themes we have seen throughout 2026: buyer demand remains healthy, but transaction volume is strongest where buyers perceive a compelling relationship between price and property quality.
The 42 pending transactions also provide a healthy pipeline of potential closings as the market moves into Q4.
What Q3 Means for Sellers
Q3 should be encouraging for North Shore luxury sellers.
Transaction volume increased substantially, sellers captured a higher percentage of their asking prices, and the median sold property still moved in just over a month.
However, there are now more than 100 competing $2M+ listings across the communities analyzed, and the median active property has been available for approximately three months.
That makes initial pricing, presentation, and positioning increasingly important.
Sellers should be particularly careful about using other active listings as the primary basis for pricing. An active asking price reflects a seller’s expectations; closed and pending transactions provide much stronger evidence of where buyers are currently assigning value.
What Q3 Means for Buyers
For luxury buyers, the combination of 107 active listings and a 90-day median market time creates opportunities.
There is considerably more choice than in a severely inventory-constrained market, particularly among larger estates and properties requiring renovation.
Buyers may have greater negotiating leverage on homes that have been on the market for an extended period, require significant capital improvements, or are competing against several similar properties.
At the same time, Q3’s 34-day median marketing time and improved sale-to-list ratios show why buyers should not assume that every seller will entertain a substantial discount.
When a compelling property is introduced at a price the market recognizes as fair, competition can still develop quickly.
Looking Ahead to Q4
The North Shore luxury market enters the final quarter of 2026 with more inventory, a substantial pipeline of pending transactions, and considerably stronger transaction volume than we saw during Q2.
The defining theme remains selectivity rather than inactivity.
Buyers are transacting, including at the highest levels of the market, but they continue to differentiate sharply between homes that offer compelling value and those that do not.
For sellers, that means accurate pricing and thoughtful positioning remain critical. For buyers, elevated inventory creates more opportunity to compare properties and negotiate selectively.
With 42 $2M+ homes already pending at the time of this analysis, the final quarter of 2026 should provide additional clarity on whether the increased transaction activity seen during Q3 carries through the end of the year.
Interested in More Updates?
Visit the Market Updates page for monthly market activity or contact me to subscribe to the North Shore Newsletter.
Market statistics are based on the $2M+ residential MLS data set analyzed for Brookville, Old Brookville, Upper Brookville, Old Westbury, Locust Valley, Glen Head, Glen Cove, Oyster Bay, Oyster Bay Cove, Roslyn, and Sea Cliff. The figures are intended to provide a snapshot of the North Shore luxury market and should not be interpreted as statistics for the overall residential market in these communities. Individual property values can vary substantially based on village, school district, location, acreage, condition, amenities, and other property-specific factors.